
RTX PRO 6000 FP4: MTP vs Off Speculative Decoding
Speculative decoding comparison of MTP versus Off on RTX PRO 6000 FP4 (NVIDIA Blackwell) running Qwen 3.5 397B-A17B. Throughput, cost, and interactivity differences across LLM workloads. Use the chart controls below to switch sequences and metrics — same interactions as the main inference chart.
MTP acceptance-rate implementations differ across inference engines. Points from different engines are not directly comparable on the same curve — throughput and cost at matched interactivity may reflect engine-level differences rather than pure speculative decoding gains. Interpret cross-engine comparisons with caution.
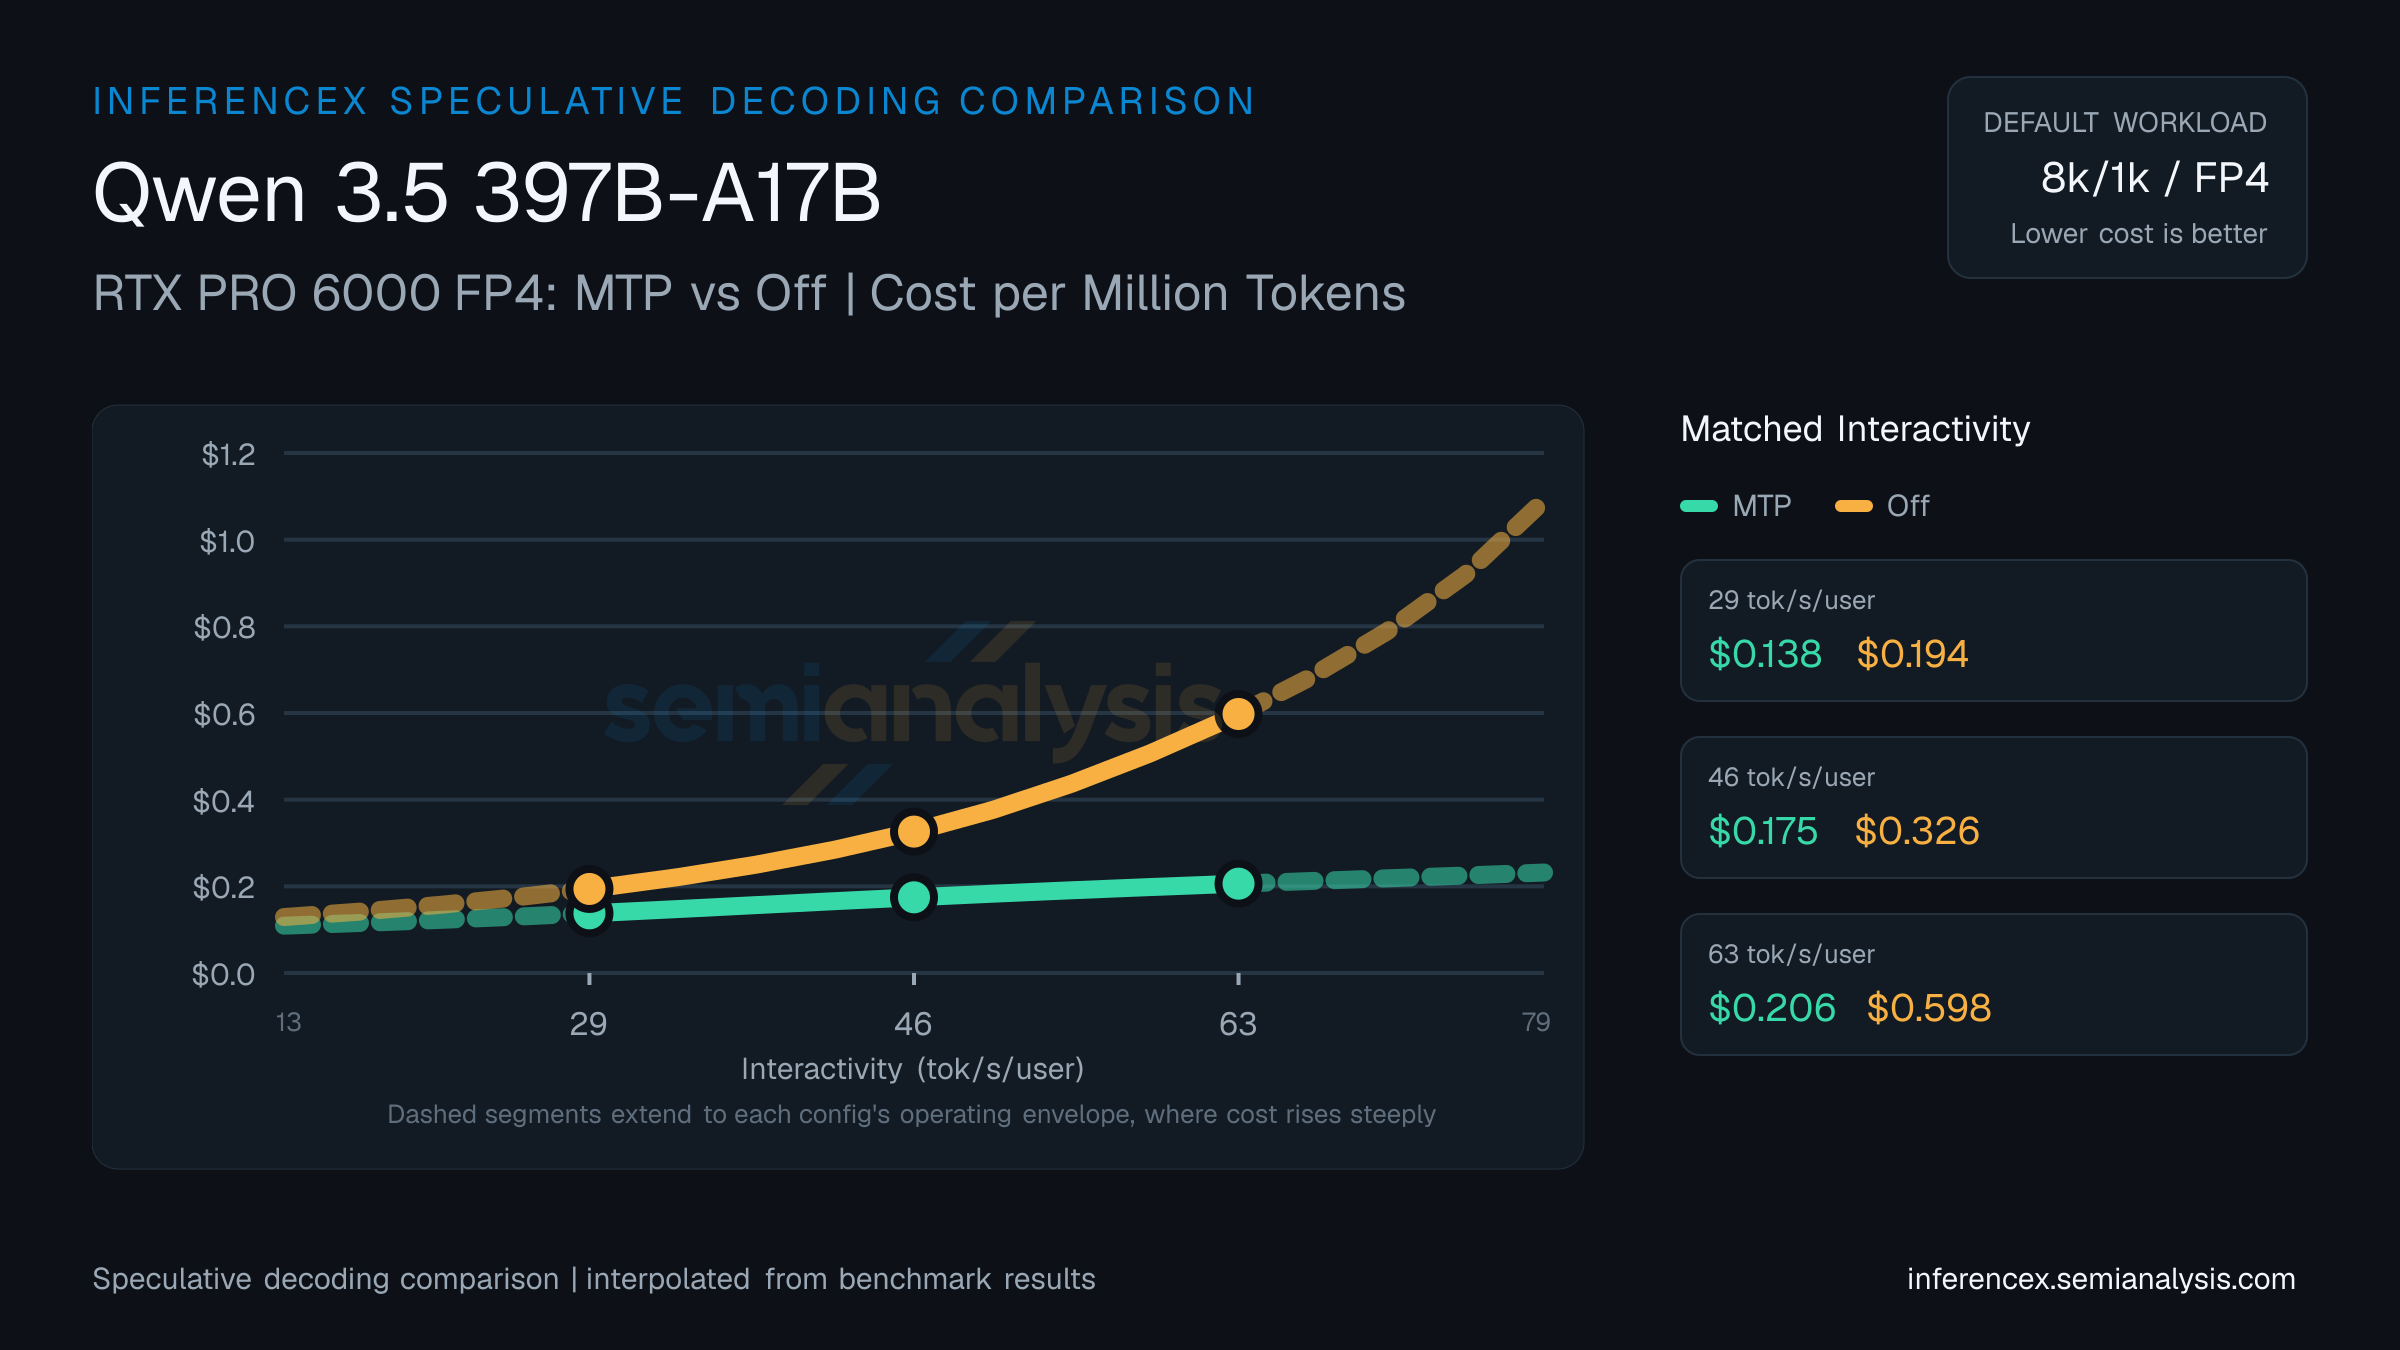
MTP posts 1372 tok/s/chip for $0.14 per million tokens at 29 tok/s/user on Qwen 3.5 397B-A17B (RTX PRO 6000 FP4); Off posts 974 tok/s/chip for $0.19. MTP is 41% cheaper per token; MTP delivers 41% more tok/s/chip. Draft-token acceptance rates determine whether speculative decoding helps or hurts at a given concurrency level.
Throughput at 46 tok/s/user on Qwen 3.5 397B-A17B (RTX PRO 6000 FP4): MTP hits 1082 tok/s/chip, Off hits 579. Per-million costs land at $0.17 and $0.33 respectively. MTP is 87% cheaper per token; MTP delivers 87% more tok/s/chip. Speculative decoding trades extra compute on draft tokens for fewer decoding steps — the payoff depends on sequence length and batch size.
Toward the upper edge of the 13–79 tok/s/user interactivity band, at 63 tok/s/user on Qwen 3.5 397B-A17B (RTX PRO 6000 FP4): MTP runs 916 tok/s/chip at $0.21/M tokens, Off runs 316 at $0.60/M. MTP is 190% cheaper per token; MTP delivers 190% more tok/s/chip. Gains from speculative decoding vary by workload; short-output prompts tend to benefit less. (Numbers reflect this URL's pinned 8k/1k · fp4 workload — changing sequence or model updates both the table and chart; the table stays pinned to this page's precision, so precision toggles in the controls affect the chart only.)
| Metric | Interactivity (tok/s/user) | Interactivity (tok/s/user) | Interactivity (tok/s/user) |
|---|---|---|---|
| Throughput (tok/s/chip) | MTP:1372.3Off:974.0 | MTP:1081.7Off:578.9 | MTP:916.3Off:316.0 |
| Cost ($/M tok) | MTP:$0.138Off:$0.194 | MTP:$0.175Off:$0.326 | MTP:$0.206Off:$0.598 |
| tok/s/MW | MTP:1407493Off:998961 | MTP:1109396Off:593735 | MTP:939801Off:324130 |
| Concurrency | MTP:~26Off:~16 | MTP:~13Off:~6 | MTP:~8Off:~2 |
Inference Performance
Agentic inference metrics from the AgentX scenario and fixed-sequence inference metrics across models, hardware configurations, and serving parameters.