
B300 FP4: M3 EAGLE vs Off Speculative Decoding
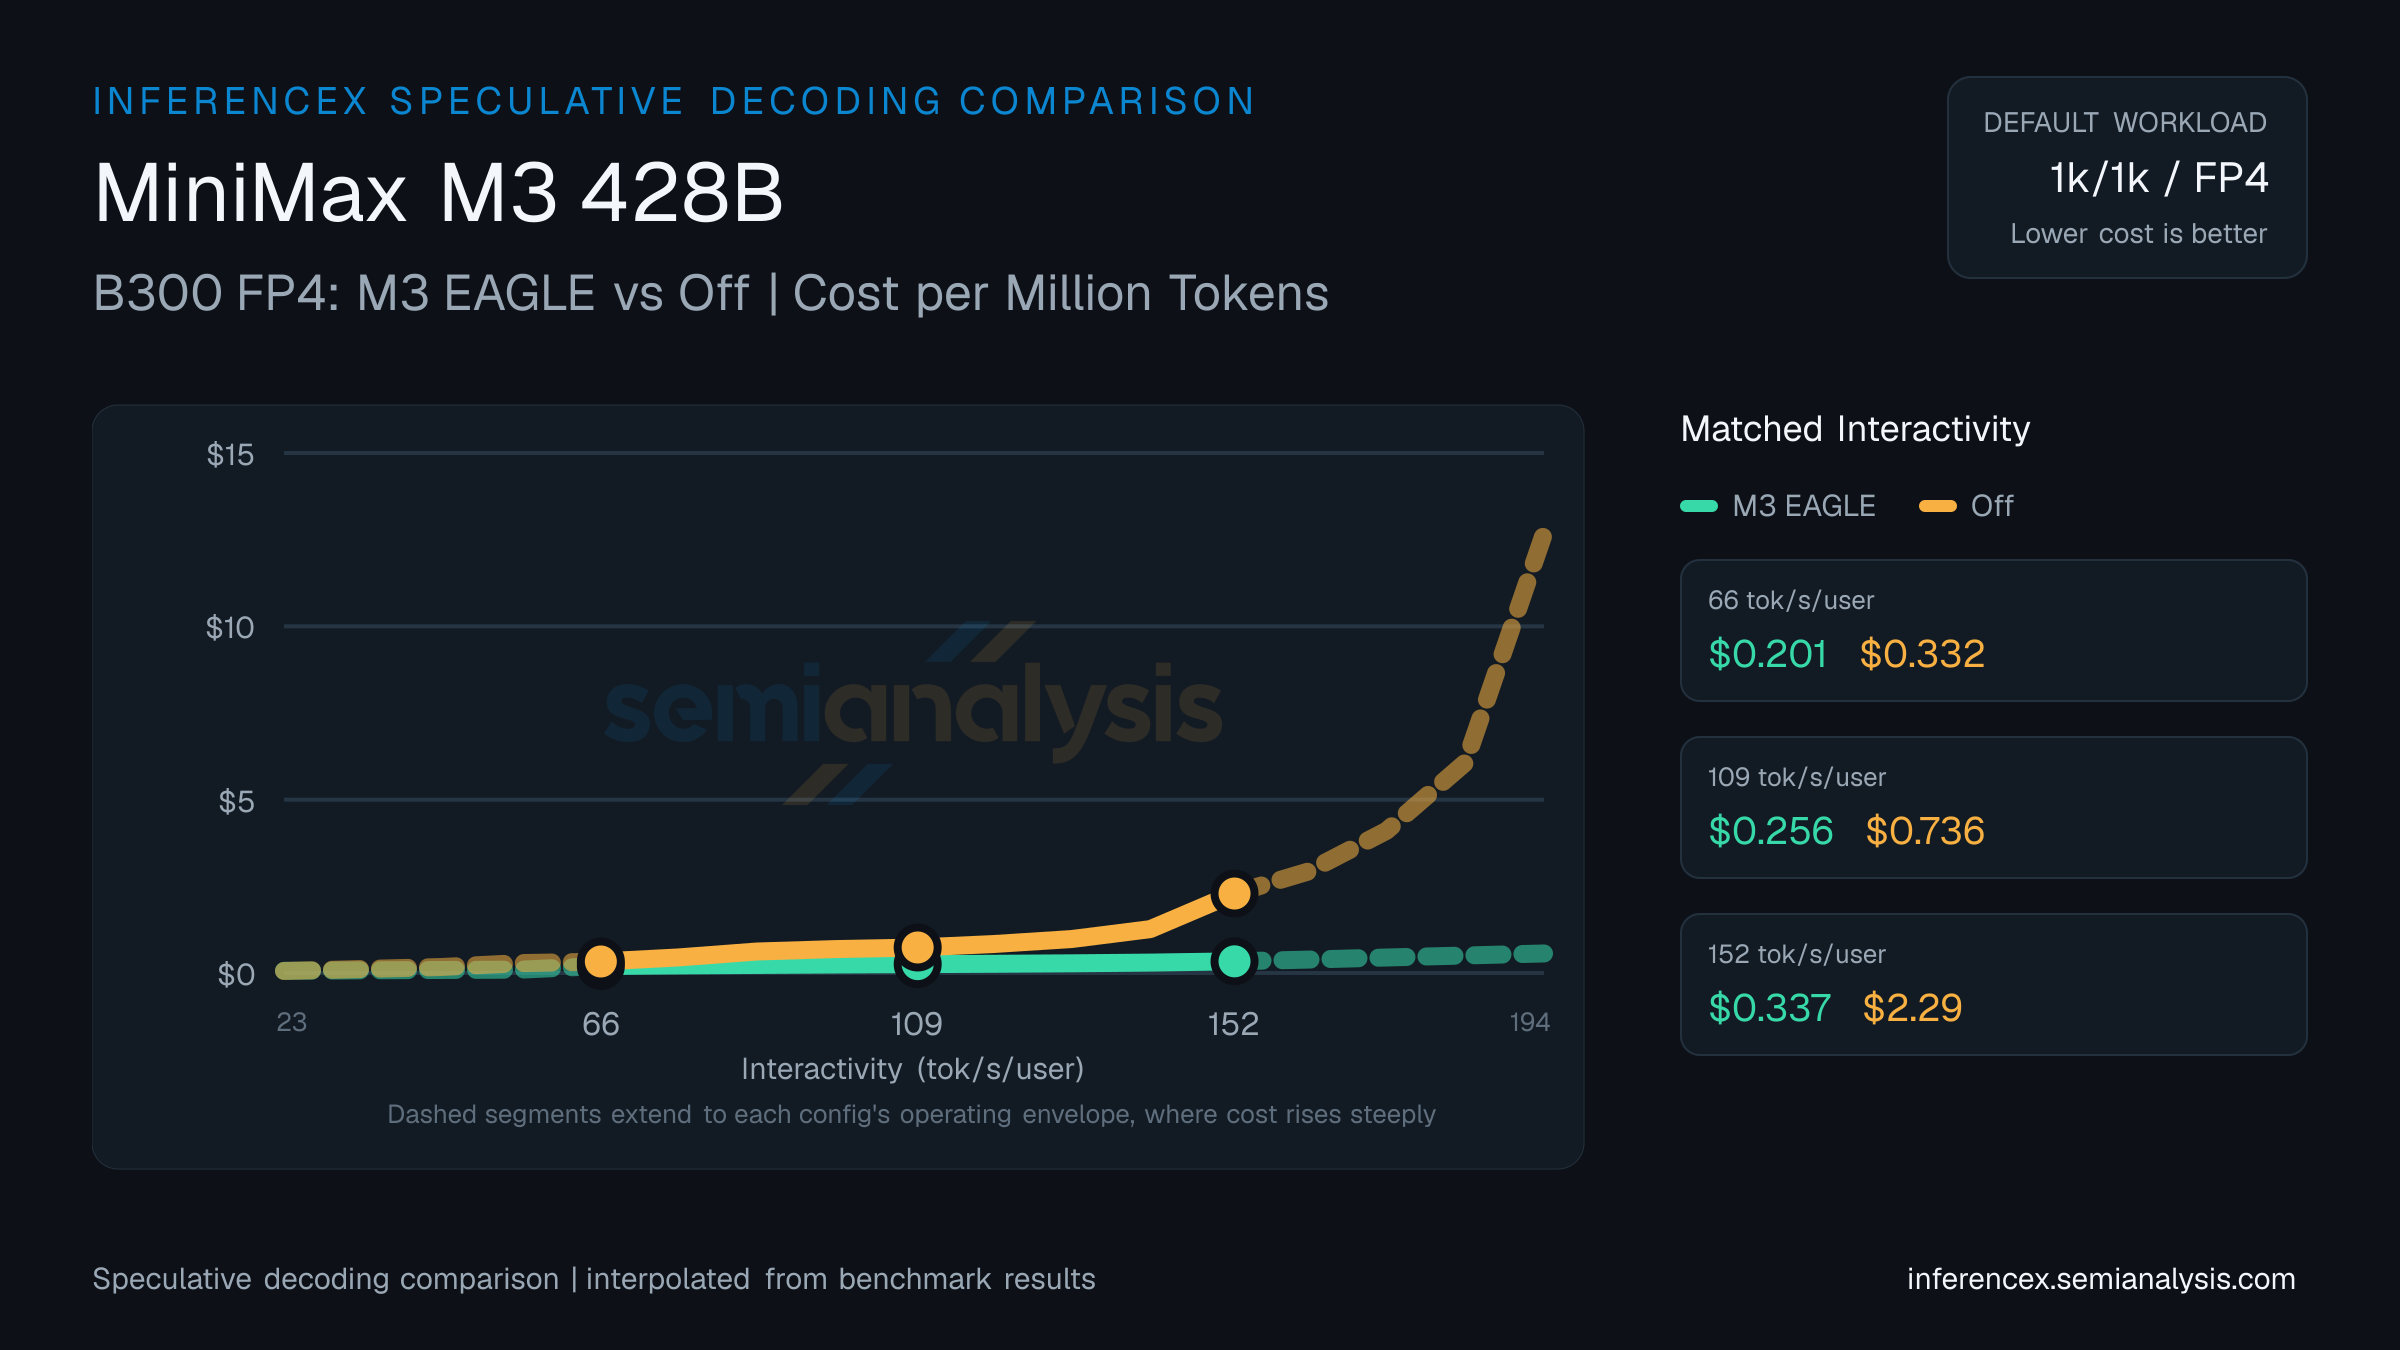
Speculative decoding comparison of M3 EAGLE versus Off on B300 FP4 (NVIDIA Blackwell) running MiniMax M3 428B. Throughput, cost, and interactivity differences across LLM workloads. Use the chart controls below to switch sequences and metrics — same interactions as the main inference chart.
MTP acceptance-rate implementations differ across inference engines. Points from different engines are not directly comparable on the same curve — throughput and cost at matched interactivity may reflect engine-level differences rather than pure speculative decoding gains. Interpret cross-engine comparisons with caution.
Near the low end of the 21–241 tok/s/user interactivity band, at 76 tok/s/user on MiniMax M3 428B (B300 FP4): M3 EAGLE runs 13413 tok/s/chip at $0.05/M tokens, Off runs 6020 at $0.10/M. M3 EAGLE is 123% cheaper per token; M3 EAGLE delivers 123% more tok/s/chip. Gains from speculative decoding vary by workload; short-output prompts tend to benefit less.
At 131 tok/s/user on MiniMax M3 428B (B300 FP4), M3 EAGLE delivers 5595 tok/s/chip at $0.11 per million tokens; Off delivers 2498 tok/s/chip at $0.25. M3 EAGLE is 124% cheaper per token; M3 EAGLE delivers 124% more tok/s/chip. Speculative decoding accepts draft tokens to reduce per-token latency — gains vary by workload and prompt distribution.
M3 EAGLE posts 4034 tok/s/chip for $0.16 per million tokens at 187 tok/s/user on MiniMax M3 428B (B300 FP4); Off posts 1181 tok/s/chip for $0.53. M3 EAGLE is 241% cheaper per token; M3 EAGLE delivers 241% more tok/s/chip. Draft-token acceptance rates determine whether speculative decoding helps or hurts at a given concurrency level. (Numbers reflect this URL's pinned 8k/1k · fp4 workload — changing sequence or model updates both the table and chart; the table stays pinned to this page's precision, so precision toggles in the controls affect the chart only.)
| Metric | Interactivity (tok/s/user) | Interactivity (tok/s/user) | Interactivity (tok/s/user) |
|---|---|---|---|
| Throughput (tok/s/chip) | M3 EAGLE:13413.2Off:6019.7 | M3 EAGLE:5595.4Off:2498.2 | M3 EAGLE:4034.3Off:1181.4 |
| Cost ($/M tok) | M3 EAGLE:$0.047Off:$0.104 | M3 EAGLE:$0.112Off:$0.251 | M3 EAGLE:$0.156Off:$0.531 |
| tok/s/MW | M3 EAGLE:7059567Off:3168275 | M3 EAGLE:2944956Off:1314825 | M3 EAGLE:2123312Off:621805 |
| Concurrency | M3 EAGLE:~454Off:~421 | M3 EAGLE:~10Off:~7 | M3 EAGLE:~8Off:~8 |
Inference Performance
Agentic inference metrics from the AgentX scenario and fixed-sequence inference metrics across models, hardware configurations, and serving parameters.