
MI355X: FP4 vs INT4 Precision Comparison
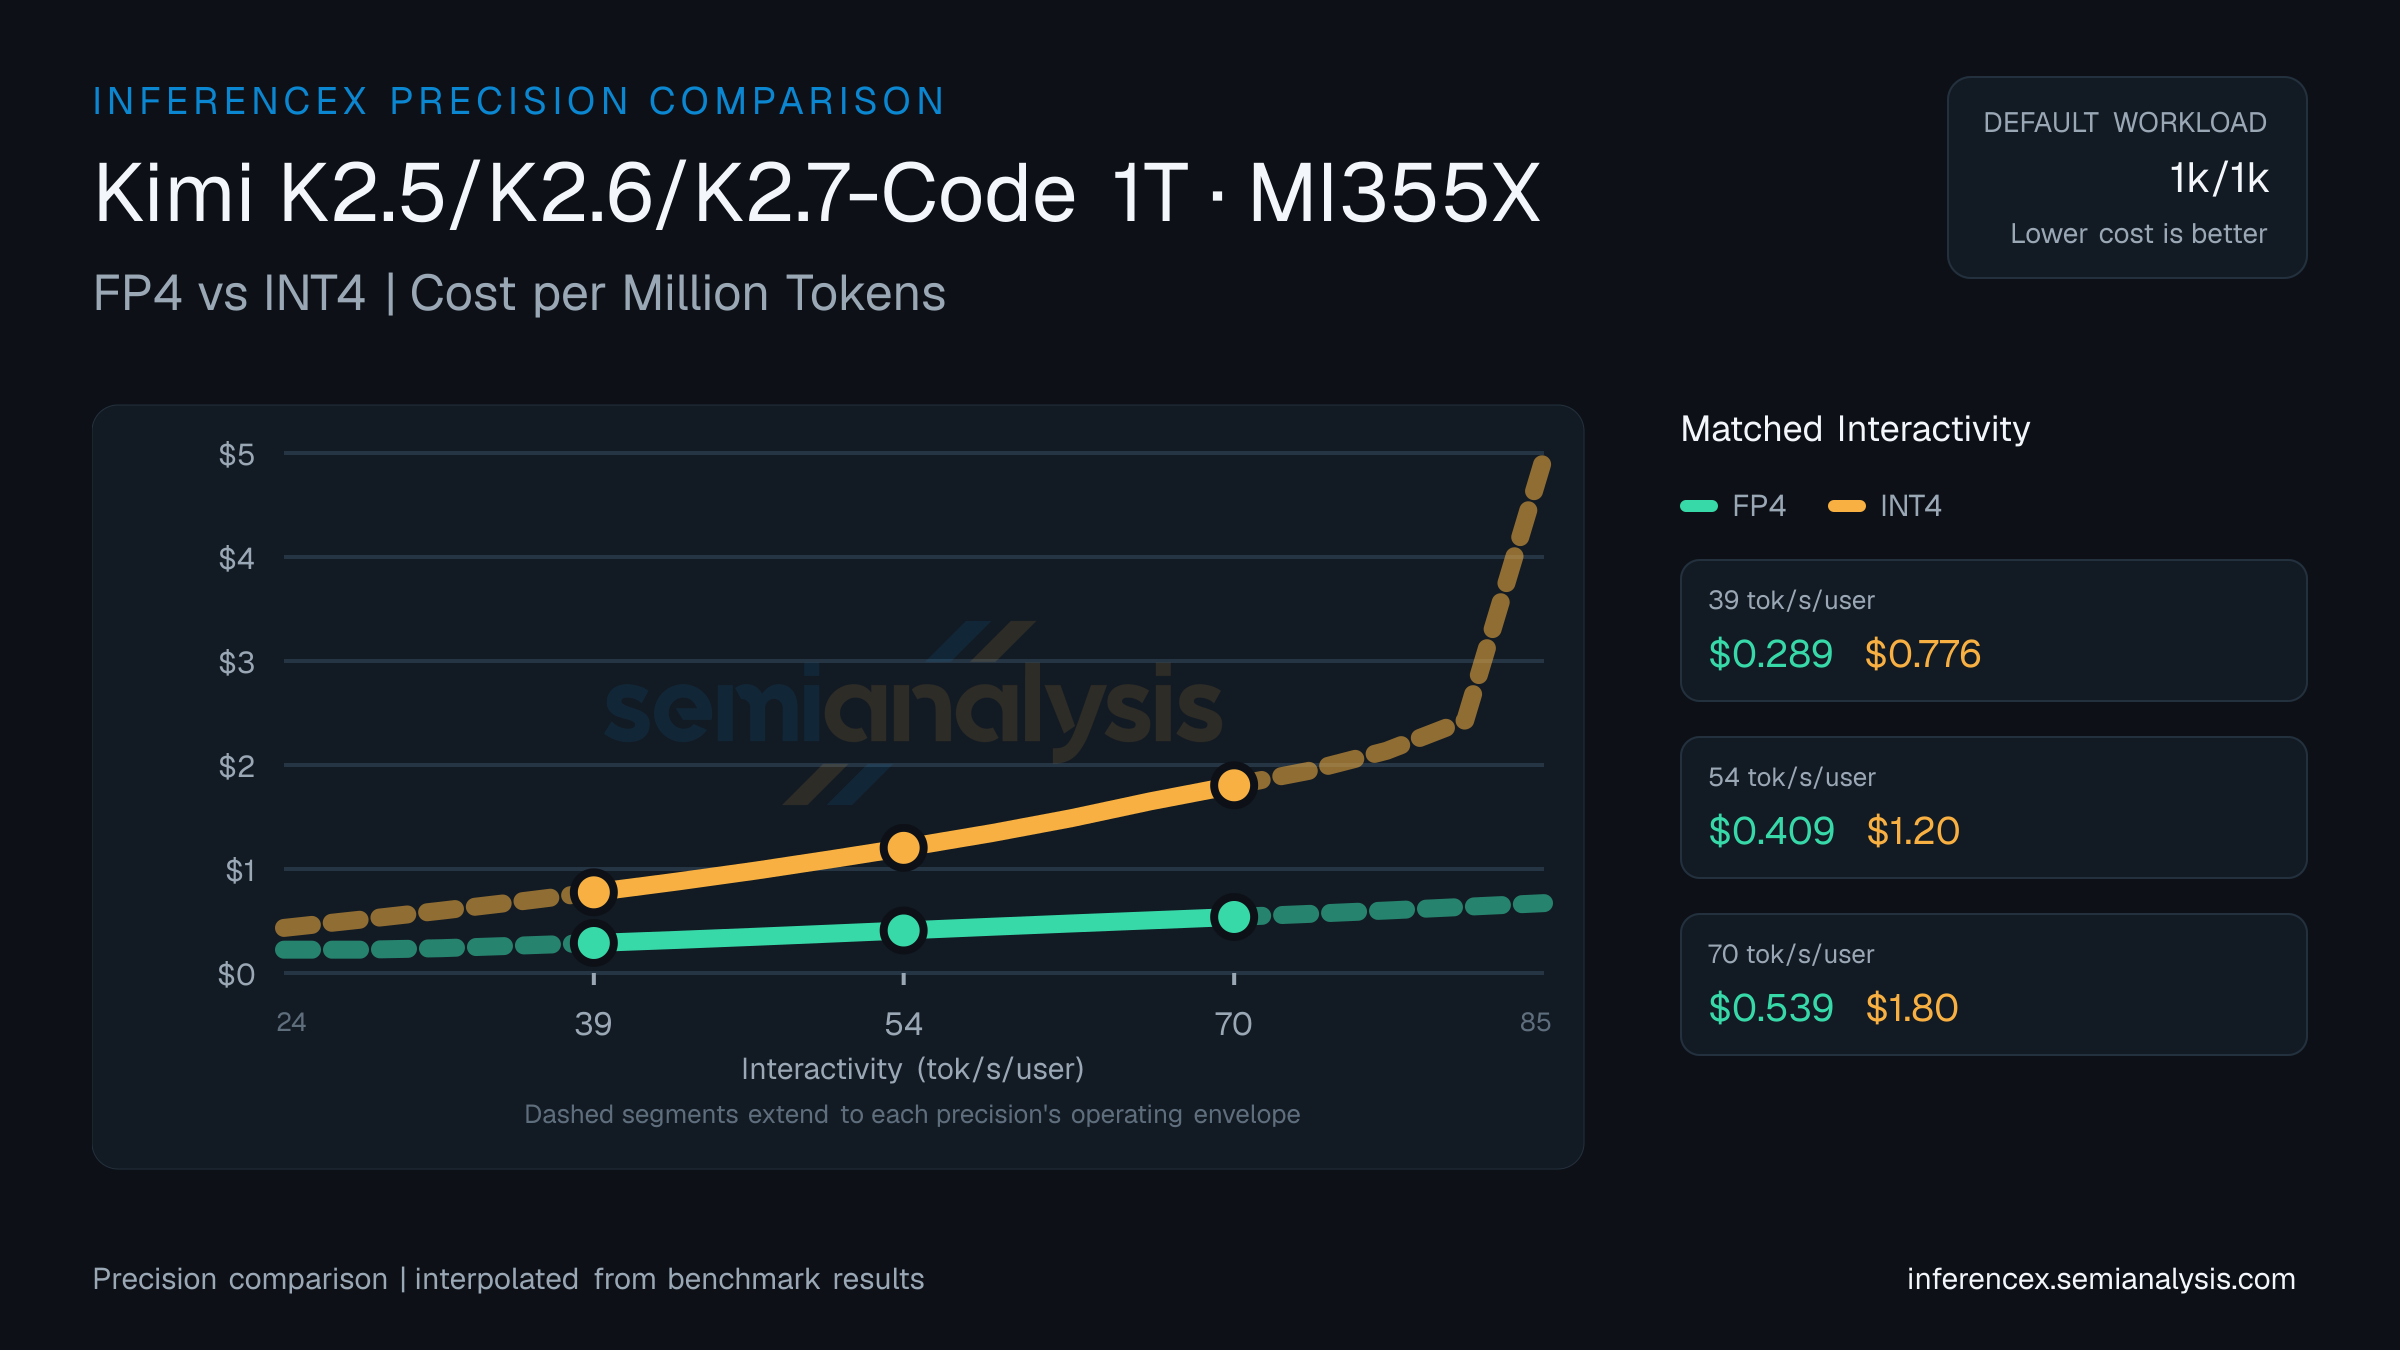
How FP4 and INT4 precision affect Kimi K2.5/K2.6/K2.7-Code 1T inference on MI355X (AMD CDNA 4). Throughput, latency, and cost across LLM workloads. Use the chart controls below to switch sequences and metrics — same interactions as the main inference chart.
Throughput at 27 tok/s/user on Kimi K2.5/K2.6/K2.7-Code 1T (MI355X): FP4 hits 4934 tok/s/chip, INT4 hits 1791. Per-million costs land at $0.08 and $0.23 respectively. FP4 is 176% cheaper per token; FP4 delivers 176% more tok/s/chip. The cost-throughput tradeoff from lower precision is only part of the picture — see the evaluation page for accuracy data.
Around the middle of the 11–78 tok/s/user interactivity band, at 44 tok/s/user on Kimi K2.5/K2.6/K2.7-Code 1T (MI355X): FP4 runs 3522 tok/s/chip at $0.12/M tokens, INT4 runs 1224 at $0.34/M. FP4 is 188% cheaper per token; FP4 delivers 188% more tok/s/chip. Precision changes affect both inference speed and model quality — consult the evaluation tab for accuracy benchmarks.
At 61 tok/s/user on Kimi K2.5/K2.6/K2.7-Code 1T (MI355X), FP4 delivers 2692 tok/s/chip at $0.15 per million tokens; INT4 delivers 863 tok/s/chip at $0.48. FP4 is 212% cheaper per token; FP4 delivers 212% more tok/s/chip. Lower-precision quantization trades model accuracy for throughput — check the evaluation page for quality impact. (Numbers reflect the default 8k/1k selection for this URL — table and chart below update if you change sequence or model in the controls. Each side uses the best available serving configuration for that precision, which may include speculative decoding such as MTP where recipes exist — the same convention as the other comparison pages.)
| Metric | Interactivity (tok/s/user) | Interactivity (tok/s/user) | Interactivity (tok/s/user) |
|---|---|---|---|
| Throughput (tok/s/chip) | FP4:4933.9INT4:1790.9 | FP4:3522.1INT4:1224.1 | FP4:2691.8INT4:863.1 |
| Cost ($/M tok) | FP4:$0.084INT4:$0.233 | FP4:$0.118INT4:$0.340 | FP4:$0.155INT4:$0.483 |
| tok/s/MW | FP4:2360720INT4:856871 | FP4:1685225INT4:585711 | FP4:1287933INT4:412954 |
| Concurrency | FP4:~250INT4:~31 | FP4:~49INT4:~13 | FP4:~20INT4:~6 |
Inference Performance
Agentic inference metrics from the AgentX scenario and fixed-sequence inference metrics across models, hardware configurations, and serving parameters.